If you're an industrialist, then industrial performance indicators should definitely be a topic you're familiar with! These indicators are essential for evaluating efficiency, productivity, product quality, and the profitability of your industrial activities. If you're not yet familiar with these concepts, let's delve into the main indicators that can help you monitor your performance, the standards they adhere to, and how they have evolved over time.
AFNOR Standards
Before discussing the different indicators and their calculation methods, we first need to talk about the standards they depend on: the AFNOR standards. Developed by the French Association for Standardization, these standards ensure quality, safety, and performance across various sectors, including industry. While adherence to these standards is optional, they are often required by the market and are regularly updated to keep pace with technological advancements.
Key Industrial Performance Indicators
Now that you understand the standards, let's talk about those that apply specifically to industry and, more precisely, to the monitoring of industrial performance. We'll focus on the NFE 60-182 standard, a unique and common reference in the industrial sector that harmonizes the methods for calculating performance indicators such as OEE (Overall Equipment Effectiveness), OOE ( Overall Operational Efficiency ), TEEP (Total Effective Equipment Performance), and the Pareto of losses. Here’s a detailed look at some key indicators from this standard:
Overall Equipment Effectiveness (OEE)
OEE is the flagship indicator of the industry! This indicator measures the overall performance of equipment, which aids in company management. If a machine is down for maintenance and it's not scheduled for work, OEE ignores this downtime.
Calculation:
OEE = Performance x Quality x Availability
(Availability = Actual Production Time / Scheduled Time)
OEE ranges from 0 to 100%. The closer the OEE is to 100%, the more efficient the production.
Overall Operational Efficiency (OOE)
OOE is similar to OEE but is more stringent because it takes unscheduled time into account, looking at Total Operations Time as the maximum. This indicator is based on the plant's operating time rather than the required time. It measures the ratio between useful time and the operating time of your plant (i.e., the accessibility to your production workshop).
Calculation:
OOE = OEE x Availability ratio
(Availability = Actual Production Time / Operating Time)
OOE considers both scheduled and unscheduled times, providing a comprehensive view of operational efficiency.
Total Effective Equipment Performance (TEEP)
TEEP is used to determine the production time of conforming parts relative to the total production time. This helps better understand your profitability and allows for necessary adjustments. TEEP considers the maximum time to be All Available Time, which is 24 hours a day, 365 days a year.
Calculation:
TEEP = OOE x Capacity Utilization
(Availability = Actual Production Time / All Available Time)
TEEP measures the effectiveness of equipment on an absolute scale, showing what is truly possible if equipment were to operate non-stop.
Causes of Losses
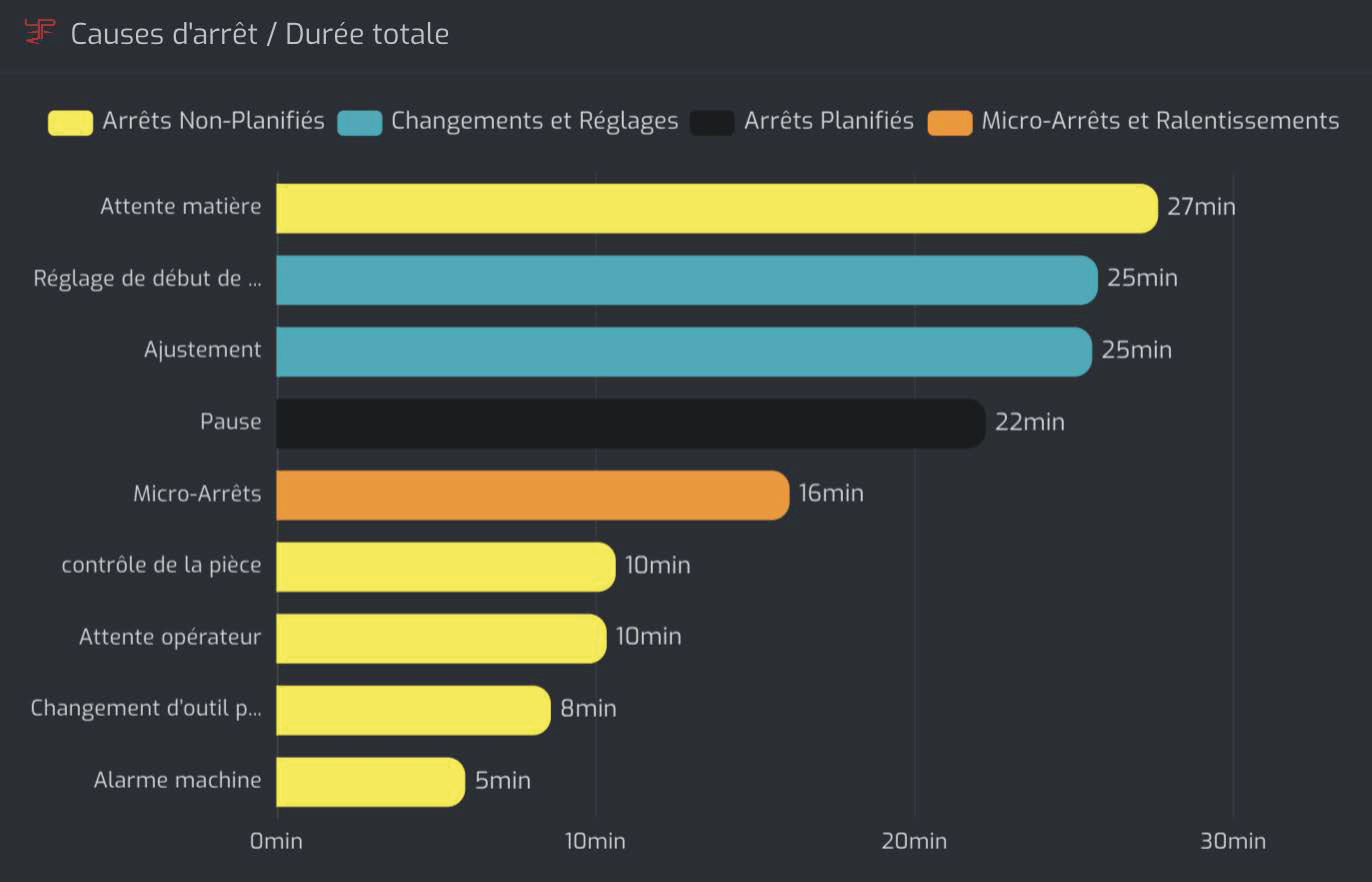
In factories, every minute counts, but production processes often encounter numerous downtimes, making this a critical indicator to monitor. It is crucial to measure the duration and causes of these stops. This is where the Pareto of losses comes into play, identifying and prioritizing the main causes of productivity losses in a factory and highlighting the factors that most negatively impact efficiency.

What are they used for?
These indicators are crucial for gaining a deeper understanding of your production processes, how your machines function, and the detailed outcomes of your production efforts. With this information, you can thoroughly analyze your workshop's performance and, if necessary, implement corrective actions, or simply enhance areas that are already performing well.
Each indicator is significant and must be calculated with precision to ensure the results accurately reflect the reality of your operations. This allows you to better manage and justify your actions to both your management team and operators, ensuring informed decision-making and effective operational oversight.
Collecting Indicators
Talking about complex calculations and the importance of following industrial performance indicators in your workshop is one thing, but we haven't yet discussed how to improve data recovery to simplify its use even further.
📝 Paper version required daily mobilization of a technician to fill in the day's data.
💻 Manual computer version using a spreadsheet like Excel, where data must be manually filled in by the operator daily.
📈 MES (Manufacturing Execution System) has relieved operators by automatically uploading information through production management software.
🚀 KEYPROD collects all performance indicators in real-time through a simple and quick-to-install machine monitoring solution, enabling effective decisions to enhance production swiftly.
With this comprehensive understanding of industrial performance indicators, you're now ready to collect relevant data, calculate the rates that interest you, and implement necessary actions for continuous improvement and productivity enhancement within your organization. Start now with KEYPROD to discover how to optimize your production efficiently and swiftly.